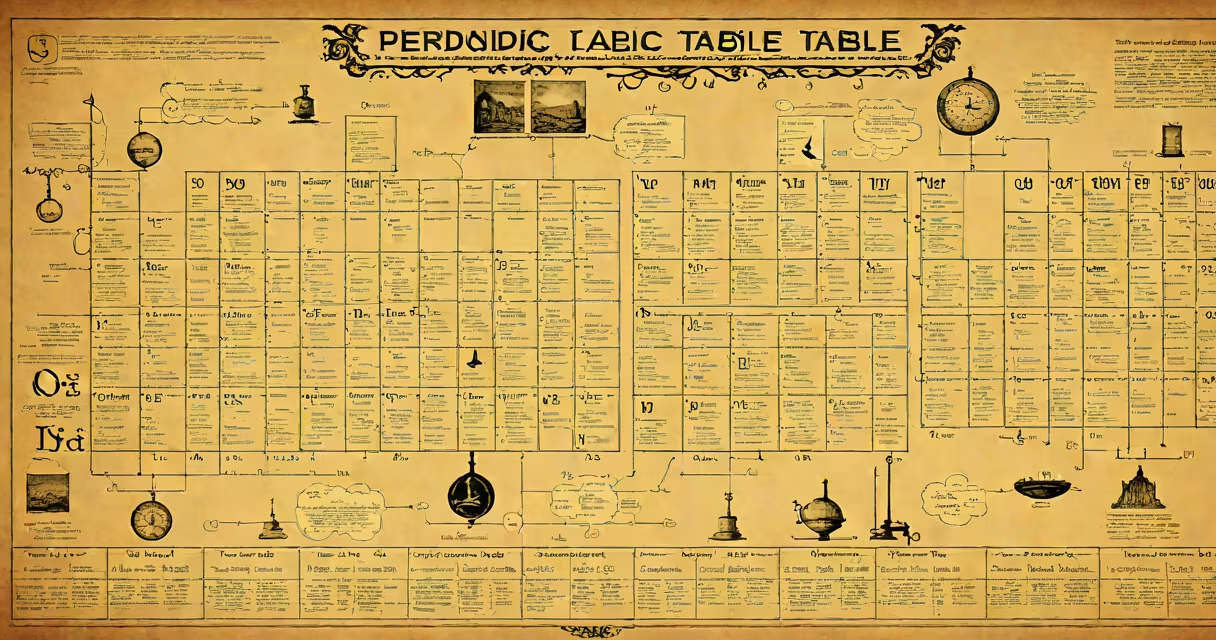
The periodic table timeline tracks the chronological development of chemical elements and their classification, from early alchemical ideas to the modern arrangement of 118 confirmed elements based on atomic number and recurring properties.
Scientific understanding of matter advanced through centuries of experimentation and observation. Early civilizations recognized basic substances like gold, silver, and sulfur. By the 18th century, chemists identified oxygen, nitrogen, and hydrogen as distinct elements. The timeline reflects how systematic classification replaced earlier speculative models.
Modern periodic tables emerged from efforts to organize known elements by patterns in their physical and chemical behavior. Dmitri Mendeleev's 1869 version predicted undiscovered elements based on gaps in his table. His predictions were later confirmed, validating the power of pattern-based organization. Today's periodic table timeline shows how science refined this model using atomic structure and quantum theory.
Each entry on the periodic table timeline marks a milestone in element discovery or theoretical advancement. These milestones include the first identification of an element, the proposal of a new classification system, or the synthesis of a new artificial element.
Timeline entries are ordered by date, with each event tied to a specific scientist or research team. For example, in 1789 Antoine Lavoisier published a list of 33 elements, though many were compounds rather than pure elements. This list became a foundation for later work. In 1869, Mendeleev arranged 63 known elements by increasing atomic weight and grouped them by similar properties, leaving spaces for missing elements like gallium and germanium.
Later developments included Henry Moseley's 1913 discovery that atomic number-not atomic weight-determined an element's position. This corrected inconsistencies in Mendeleev's original table and aligned the periodic law with physics. The timeline now includes the synthesis of transuranic elements beyond uranium (atomic number 92), such as seaborgium (element 106), created in particle accelerators.
The periodic table timeline divides into four major phases: pre-modern, foundational, expansion, and synthetic.
| Phase | Timeframe | Key Developments | Notable Figures |
|---|---|---|---|
| Pre-modern | Antiquity - 1700s | Identification of basic materials; alchemical theories | Paracelsus, Robert Boyle |
| Foundational | 1789 - 1869 | Lavoisier's list; periodic law proposed; Mendeleev's predictive table | Lavoisier, John Newlands, Mendeleev |
| Expansion | 1870 - 1940 | Discovery of noble gases; actinide series; Moseley's law | William Ramsay, Niels Bohr, Moseley |
| Synthetic | 1940 - present | Creation of elements beyond uranium; confirmation via nuclear reactions | Glenn Seaborg, teams at Dubna and Livermore |
During the synthetic phase, elements 93 to 118 were created in laboratories. Element 118, oganesson, was officially named in 2016 after being synthesized in a reaction between californium and calcium. Its discovery required precise control of beam energy and detection of fleeting decay chains lasting less than a millisecond.
A common misunderstanding is that Mendeleev's table was complete or accurate from the start. In reality, he left gaps for elements not yet discovered. He correctly predicted the properties of eka-aluminum (gallium), eka-boron (scandium), and eka-silicon (germanium), which matched experimental results years later. This demonstrated that the periodic table was not just a catalog-it was a predictive structure.
Studying the periodic table timeline reveals how science progresses through hypothesis, testing, and revision. It shows that even well-established models can be improved with new evidence. For example, the placement of lutetium and hafnium in the lanthanide and d-block respectively was debated until crystallographic data confirmed their positions.
Teachers use the timeline to illustrate the process of scientific inquiry. Students see that chemistry is not static. They learn that element 112, copernicium, was first observed in 1996 at the GSI Helmholtz Centre in Germany. It was produced by fusing zinc ions with lead atoms. Confirmation took months due to low production rates-only a few atoms were detected.
One non-obvious fact: the periodic table timeline includes elements that were initially reported but later disproven. In the 1950s, claims of element 105 (later dubnium) were disputed. Independent verification by multiple labs was needed before acceptance. This shows that scientific consensus requires reproducibility, not just initial detection.
Many assume the periodic table was designed all at once. It wasn't. It evolved through decades of debate. Early versions had different groupings. For example, the "triads" of Johann Döbereiner grouped elements with similar properties, such as lithium, sodium, and potassium. But these triads didn't scale to larger sets. The periodic table timeline shows how such models were refined.
Another confusion: the idea that all elements exist naturally. Only 94 elements occur in nature. Elements 95 to 118 are synthetic. Their existence is confirmed through detection of decay products, not isolation. For example, element 117, tennessine, was created by bombarding berkelium with calcium ions. The resulting nucleus lasted 50 milliseconds before decaying into lighter elements.
I once watched a live demonstration at a science museum where a teacher used colored cards to represent elements on a timeline. Students placed cards for iron (discovered ~3000 BCE), chlorine (1774), and einsteinium (1952) on a wall chart. The visual gap between natural and synthetic elements was striking. That moment showed how much human effort went into expanding the table.
The periodic table timeline is not just a record of discovery-it is a map of scientific progress. It shows how curiosity, collaboration, and rigorous testing shaped our understanding of matter. From ancient metals to newly created superheavy elements, the timeline proves that science is cumulative, iterative, and deeply human.