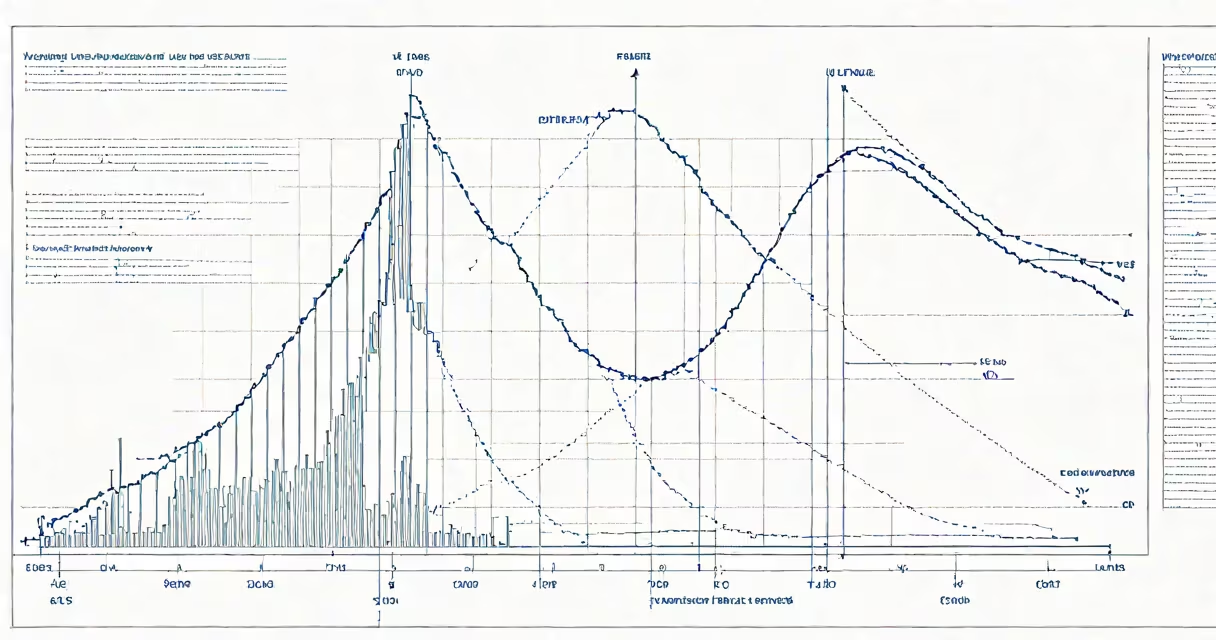
Statistical significance indicates whether an observed effect in data is likely due to a real relationship rather than random variation. It's determined by comparing a p-value to a predefined significance level, typically 0.05. This concept underpins scientific research, clinical trials, and data-driven decisions.
When researchers test a hypothesis, they assume no effect exists-the null hypothesis. They then calculate the probability of observing their data (or more extreme data) if the null were true. That probability is the p-value. If the p-value falls below the chosen significance threshold-commonly 0.05-it suggests the result is unlikely under the null, leading to rejection of the null in favor of the alternative hypothesis.
For example, a drug trial finds patients taking a new medication show a 10% greater improvement than those on placebo. The p-value is 0.03. Since 0.03 < 0.05, the result is statistically significant. Researchers conclude the drug likely has a real effect, not just chance variation. However, significance doesn't prove causation or practical importance.
Statistical significance relies on sampling distributions and known probability models. When you collect data, you're drawing a sample from a larger population. The sample statistic-like a mean or proportion-varies from sample to sample. The distribution of these sample statistics follows predictable patterns based on the central limit theorem.
Under the null hypothesis, researchers simulate or mathematically derive the expected distribution of the test statistic. For a t-test comparing two group means, the test statistic follows a t-distribution. The p-value is the area under the curve beyond the observed test statistic value. A small p-value means the observed result lies in a rare part of the distribution.
Consider a study measuring average weight loss after a diet intervention. The sample mean is 5.2 kg lost over 12 weeks. The null hypothesis assumes no weight loss (mean = 0). Using a one-sample t-test, the calculated t-statistic is 2.8. With 30 participants, the degrees of freedom are 29. The corresponding two-tailed p-value is 0.008. Because 0.008 < 0.05, the result is statistically significant. The diet likely causes weight loss.
Three elements define statistical significance: the null hypothesis, the test statistic, and the significance level (α). The significance level is set before collecting data-usually 0.05, sometimes 0.01 or 0.10. It represents the maximum acceptable risk of falsely rejecting the null (a Type I error).
A common mistake is equating statistical significance with practical importance. A result can be statistically significant yet have minimal real-world impact. For instance, a study finds a new fertilizer increases crop yield by 0.2%, with a p-value of 0.04. The result is significant, but the effect size is too small to justify changing farming practices.
Another error is assuming a non-significant result proves the null is true. A p-value above α doesn't confirm the absence of an effect-it only means the data don't provide strong enough evidence to reject the null. This is especially relevant in underpowered studies with small samples.
| Term | Definition | Example |
|---|---|---|
| Null hypothesis | Assumes no effect or difference | No difference in recovery rates between treatment and control groups |
| P-value | Probability of observing data if null is true | p = 0.02 means 2% chance of seeing such results by chance alone |
| Significance level (α) | Threshold for rejecting the null | Commonly set at 0.05 |
| Effect size | Magnitude of the observed difference | Cohen's d = 0.6 indicates a medium-sized effect |
Statistical significance is standard in medical research, psychology, economics, and social sciences. Regulatory agencies like the FDA require significance thresholds before approving new drugs. Clinical trials must demonstrate efficacy with p < 0.05 to meet approval standards.
In business, A/B testing uses significance to assess changes in user behavior. An e-commerce site tests a new checkout layout. Conversion rate increases from 2.1% to 2.4%. After running 10,000 sessions, the p-value is 0.03. The change is statistically significant, so the team implements the new design.
However, the American Statistical Association (ASA) warns against overreliance on p-values. In 2016, the ASA issued a statement emphasizing that p-values do not measure the probability that the null hypothesis is true, nor do they indicate the size or importance of an effect. They are just one tool in inference.
Statistical significance is frequently mistaken for practical significance. A result may be significant but trivial. A 2018 study found that students who drank coffee before exams scored 0.5 points higher on a 100-point scale (p = 0.01). The result is significant, but the effect is negligible in educational practice.
Another confusion is treating p-values as absolute proof. A p-value of 0.049 does not mean the result is "almost" significant. It's either significant or not, depending on the threshold. The difference between p = 0.049 and p = 0.051 is arbitrary and not meaningful in isolation.
People often misinterpret confidence intervals. A 95% confidence interval that excludes zero implies significance-but the reverse isn't always true. Some tests report significance without providing the interval, limiting interpretation.
I once ran a survey on employee satisfaction during a company-wide transition. We collected responses from 120 employees. The average satisfaction score dropped from 4.2 to 3.9 on a 5-point scale. The p-value was 0.06. I initially felt discouraged-close, but not significant. But when I looked at the effect size (Cohen's d = 0.3), I realized the drop was moderate and consistent. I recommended leadership review the findings, even though the result wasn't statistically significant. The decision wasn't based on p-values alone.